
Option 2: CPPopt trend
The CPPopt calculation over time displays a trend of ‘CPPopt’ with the additional features of weighting and averaging. This can be applied both online (bedside) and offline. Besides the benefits of displaying a trend, these additional features were developed to overcome the relatively low CPPopt yield in some (TBI) patients due to the strict curve fitting heuristics limiting its clinical (research) application. The different options are described below in text, figures and a large table (table 2) to provide a better understanding about the available CPPopt settings in the software. Please be aware that many researchers are working on this topic so the provided information might not be fully up-to-date:)
Online analysis configuration formula editor (figure 1)
Please open the Calculation function in the software, followed by selecting one of the Secondary Analysis (or Final Analysis) pages, where appropriate, where the CPPopt formula can be added to calculations. Essentially this must be an analysis stage (step/tab) at which PRx already exists (calculated in the previous step), and thus is available as one of the input variables for the formulae.
At the moment there are two functions available in the software that can be used to calculate CPPopt: OptimalValue and OptimalValueFlex. The latter one is a ‘multiwindow’ extension of the original OptimalValue function added in 2016 [1], and thus both functions share the common part of the configuration form, with the latter one having a few extra options to configure, described below.
In the figure CPPopt calculation is already defined using the OptimalValueFlex function. On the right side of the panel the function arguments are set which are ‘CPP’ (calculated from a 5 min window, to match Prx) and ‘PRx’ for the classical CPPopt calculation. On top of the panel, the calculation window specifications can be set. In this example a calculation period of 28800 seconds (8 hours) was chosen, with an update period of 60 seconds. A double click in the Formula box opens the function options for the CPPopt trend parameter which are given in figure 2.
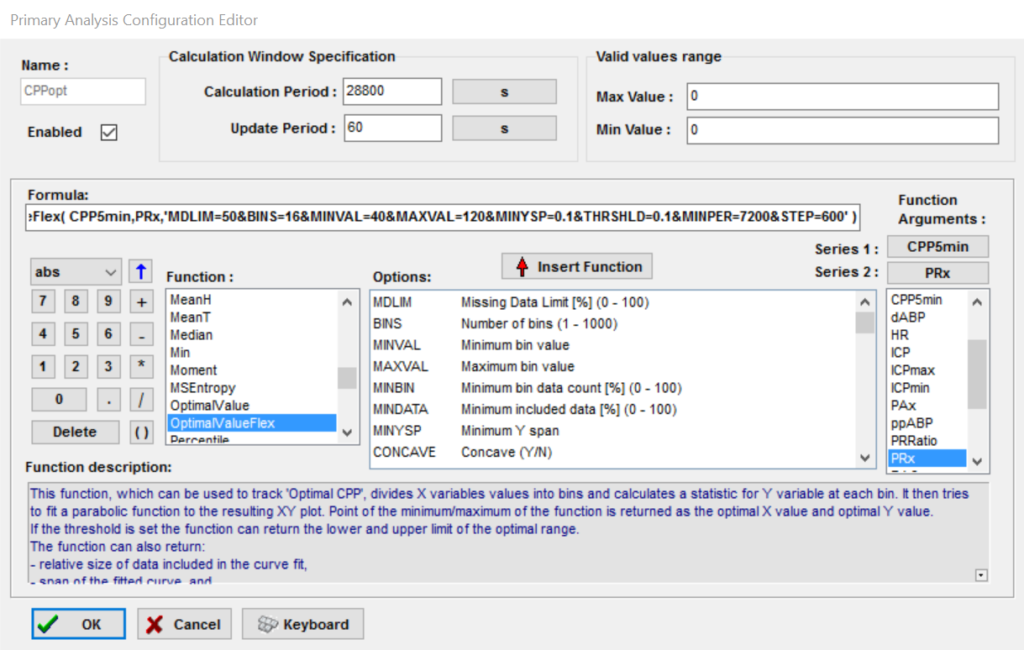
Figure 1 Selection of the CPPopt calculation option.
Function options (figure 2 and table 2)
Figure 2 shows the panel with the default (commonly used) settings for the CPPopt time trend line as available in the software. The function options panel has many settings. The first part of the panel defines the CPP-PRx curve fitting heuristic as defined under the dropdown ‘CPP-PRx error bar’ menu (see CPPopt calculation). The second part defines the multi-window and weighted average settings.
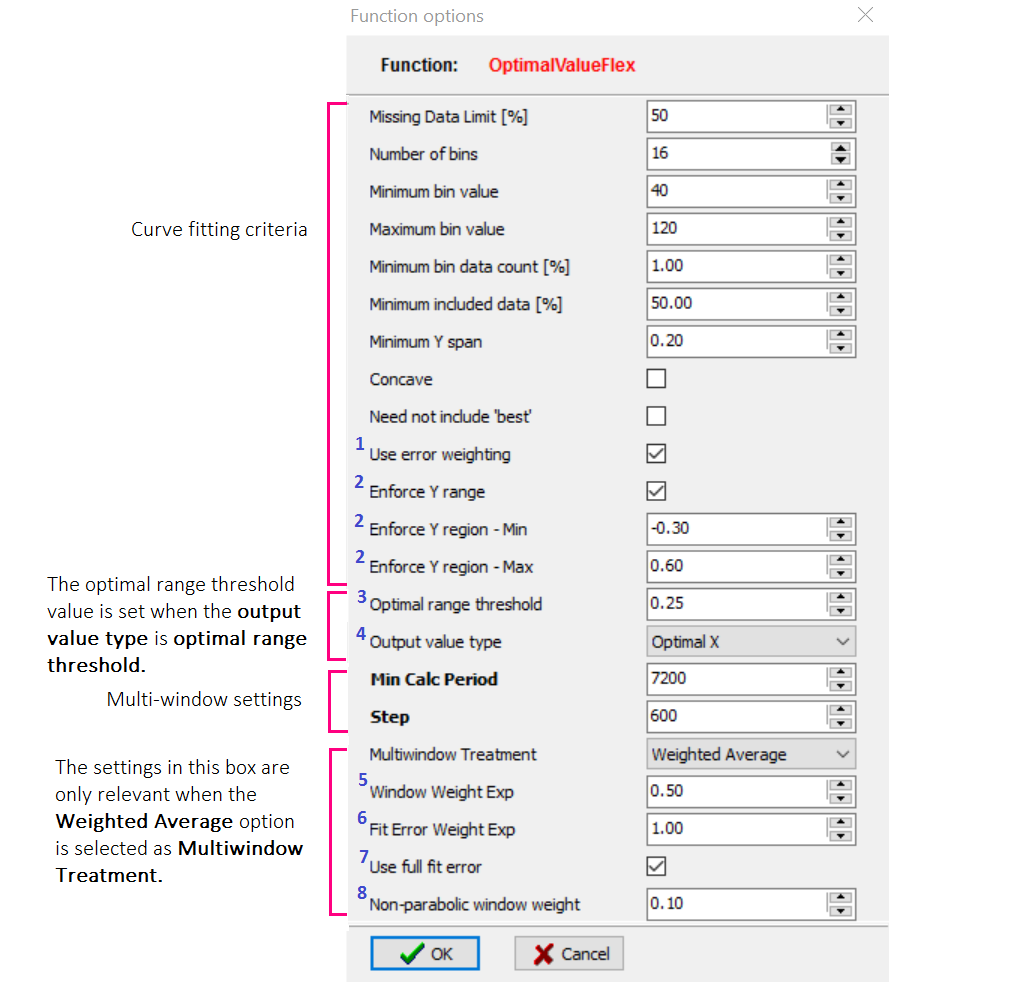
Figure 2 The default (commonly used) settings for the OptimalvalueFlex function. The numbers in blue are explained in the section ‘Additional explanation of recent features in configuration panel’ below.
CPPopt trend
Figure 3 shows an example of calculations performed over 18 hours period. Due to strict curve fitting heuristics, patients’ treatment or monitoring factors, gaps in the data can occur. Some mathematical approaches can be selected to improve the continuity and stability of the CPPopt trend [1,2]. These settings are the multi-window calculation and application of a weighted average (figure 2).
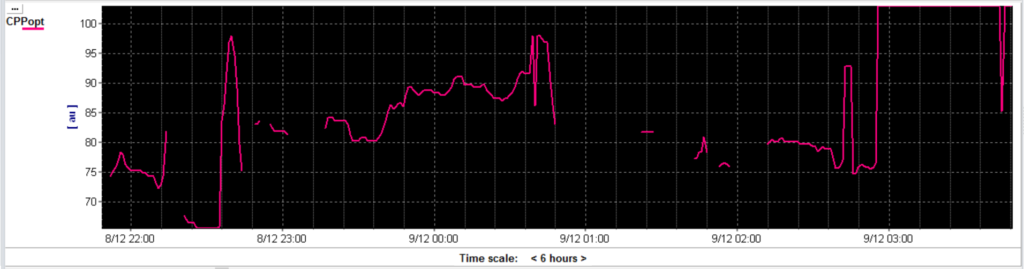
Figure 3 The CPPopt trend given for an 18 hour monitoring period using a moving calculation (single) window of 4 hours.
Multi-window CPPopt calculation with (optional) weighted average
Multi-window means that for calculating one (averaged) CPPopt, not one (single) calculation window is used but a set of calculation windows with increasing lengths [1-2] and the results of all the windows are combined. In the example used over here the maximum calculation window is set at 28800 sec (8 hours, figure 1) and the minimum is set at 7200 sec (2 hours, figure 2). As steps of 600 sec (10 min) are chosen (figure 2) in total 36 extending calculation windows are created after 8 hours of monitoring (6 hours * 60 min/10 min). Therefore after 8 hours of monitoring the CPPopt trend can consist of 36 averaged CPPopt values, the multi-window calculation. This averaged value is updated every minute.
In addition a weighted average option can be selected for the multi-window calculation according to the Equation 1, which describes how the 36 CPPopt values (or less, if some of the windows did not yield a valid value) are combined. The weighting factors include: the curve fit error, the window length and the presence/absence of a CPP-PRx U shaped curve into account. Each of these weighting rules can add more or less weight to the overall weighting factor (Weight) applied to each curve. To illustrate, when α,β,γ in the configuration are set respectively to 0.5:1.0:0.10 (as in Figure 2) the window length rule is considered to be the least ‘important’ rule in the total weighting factor, with the non-parabolic fit shape being highly penalised. More details about ‘weighted average’ is provided below (figure 9-11).
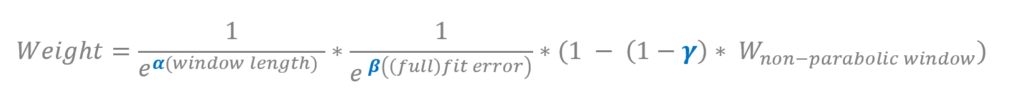
Equation 1 The different weighting rules selected to calculate one Weight for each (extending) calculation window: window length, curve fit error and CPP-PRx curve shape. α,β,γ are the separate weight factor settings in the software.
CPPopt trend result (multi-window + weighting)
Figure 4 shows the CPPopt weighted average multi-window trend. The result is much more smooth and continuous trend which, making the tool more clinically appealing and practical.
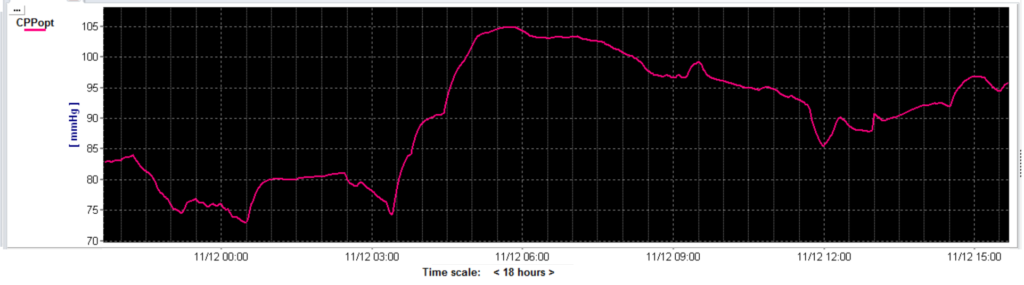
Figure 4 The CPPopt weighted multi-window trend given for an 18 hour monitoring period. Shown is the same patient’s data as in figure 3.
Additional explanation of recent features in the configuration panel
Very recently (in the most recent software release) several options have been added to the configuration panel that might improve the variability and stability of the CPPopt calculation and trends. We provide a short overview in the text and table 2 below.
1Use error weighting (figure 5)
Setting this option will influence the curve fitting process by limiting the contribution of CPP bins with large PRx error bars (larger variability).
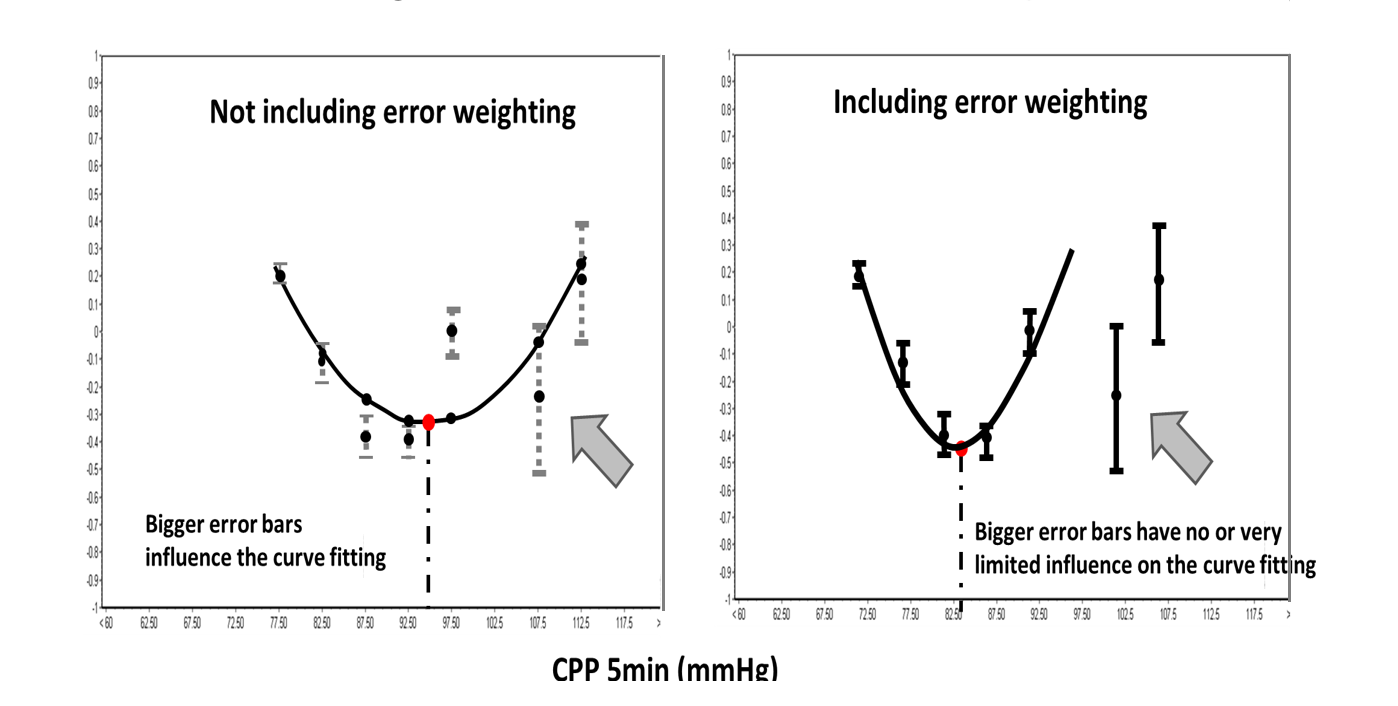
Figure 5 In the left figure all the available error bars are used for the curve fitting. In the right figure CPP bins with large PRx error bars contribute very little to the curve fitting process. Figure modified from Liu et al. Neurotrauma 2016.
2Enforce Y-region MIN/MAX (figure 6)
When the calculated CPP-PRx curve is completely out of the range MIN to MAX PRx values, no CPPopt value will be returned. This situation will occur, when the cerebrovascular reactivity is completely intact (PRx<-0.3) or entirely impaired (PRx>0.6) over the whole available CPP values range. One could argue that autoregulation guided therapy might not be applicable in those circumstances but this argument needs further exploration.
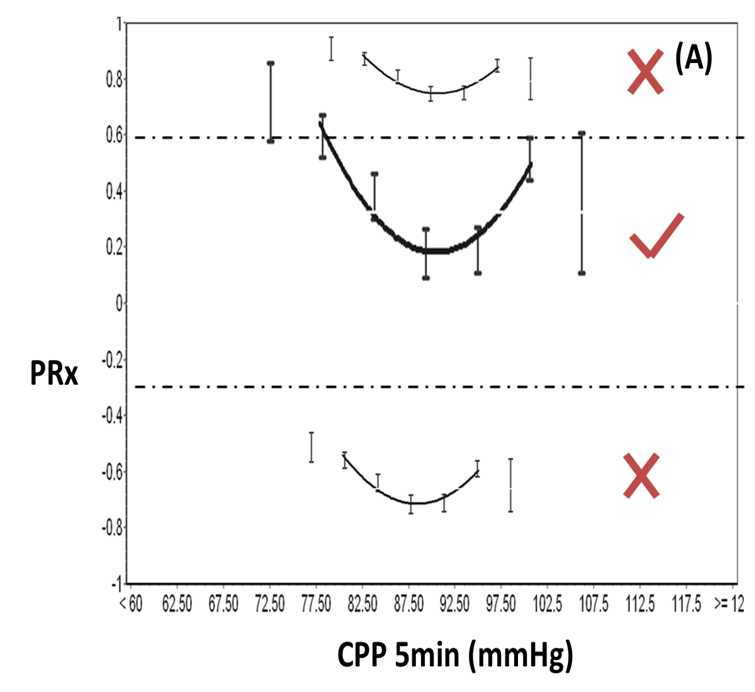
Figure 6 The fitted curves that fall completely outside the chosen MIN or MAX PRx values are rejected (X) and not visualized. Figure modified from Liu et al. Neurotrauma 2016.
3,4Optimal CPP range (figure 7 and 8)
The optimal CPP range is thought to represent an individual CPP range with intact cerebrovascular pressure reactivity [4]. It fits with the concept of the Lassen autoregulation plateau with suggested lower and upper CPP limits. The software is able to calculate this CPP range automatically if a PRx threshold for impaired autoregulation is provided. For TBI patients a PRx threshold of 0.25 is chosen but this may differ between diseases and between patients.[3] In figure 7 the result of this new calculation is shown. Besides the CPPopt, the Lower Limit of Reactivity (LLR) and the Upper Limit of Reactivity (ULR) are automatically provided. A trend of the LLR and ULR can be visualised as shown in figure 8.
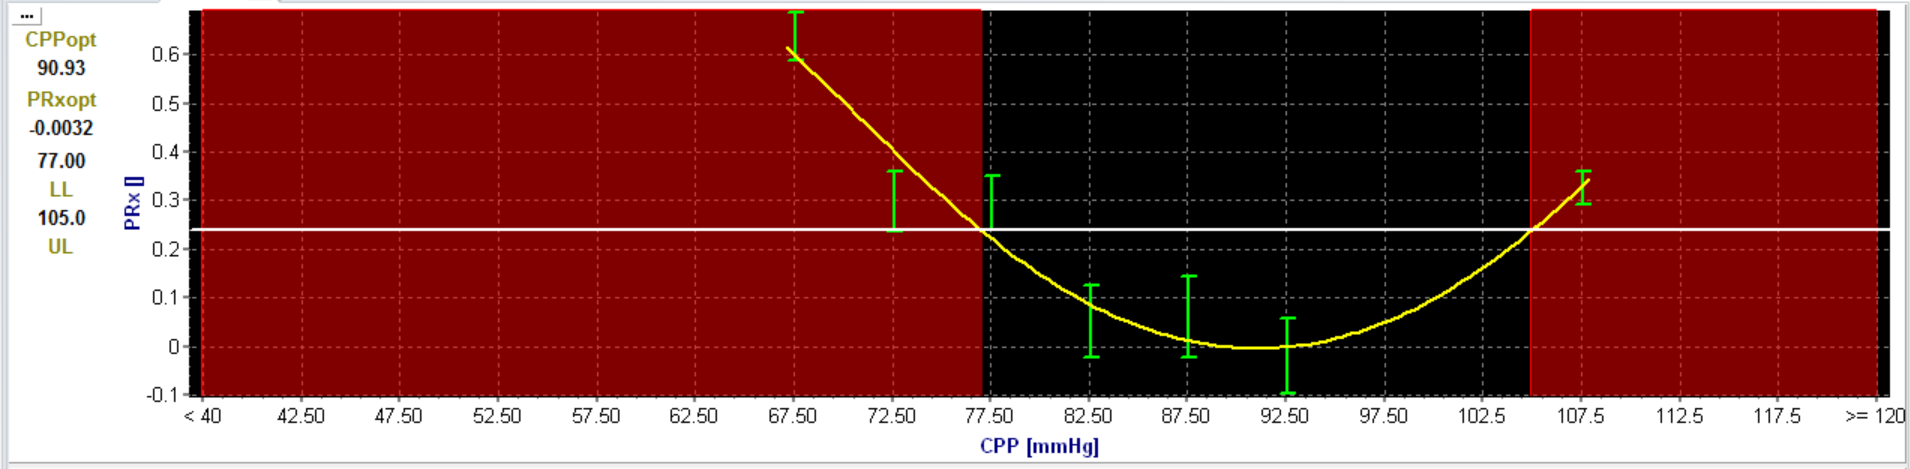
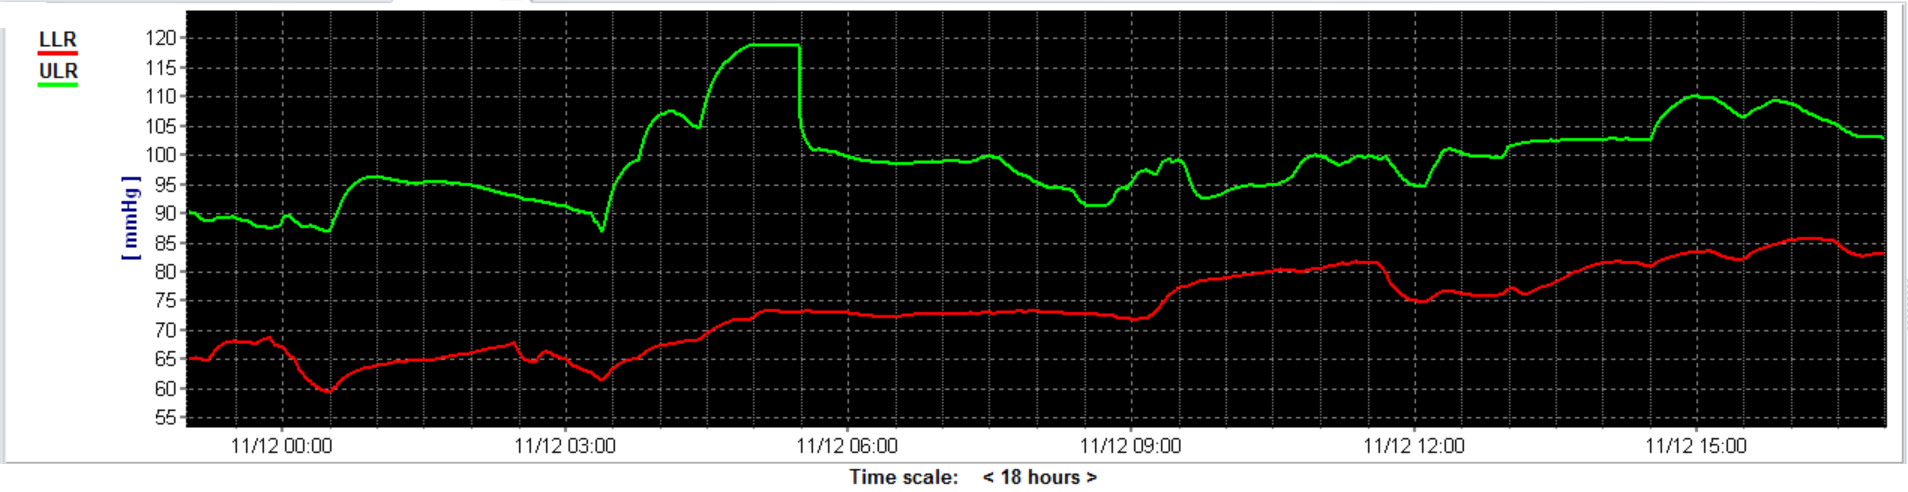
Figure 7 The dotted line is the chosen PRx threshold (0.25). The interception between the U-shaped fitted curve and the line is the Lower Limit of Reactivity (LLR) and the Upper Limit of Reactivity (ULR).
Figure 8 shows the time trend lines for the LLR (red line) and ULR (green line) in an 18 hour monitoring period.
4Output value type
Users can select different output parameters to be calculated in the software. For CPPopt calculation (or MABPopt) the ‘Optimal X’ output is selected. At present more than nine different output parameters can be selected, including CPPopt, PRxopt, LLA, ULA, and parameters describing the quality and type of the fit. Most of them still need further studies to improve understanding of their clinical significance and usefulness.
Multi-window treatment and weighted average
5Window length (figure 9)
The multi-(calculation) window increases in length retrospectively by a specified step, in our example 600s (10min), one at a time. The calculation results coming from shorter windows receive more weight in the final averaging if the weighted average (using the exponential function in Equation 1) is chosen (figure 9). In other words, more recent CPPopt data contribute more to the final calculation. Setting a higher value (between 0 and 1) of the window weight exp in the panel (α), makes the penalty for longer windows (inclusion of more historical data) higher.
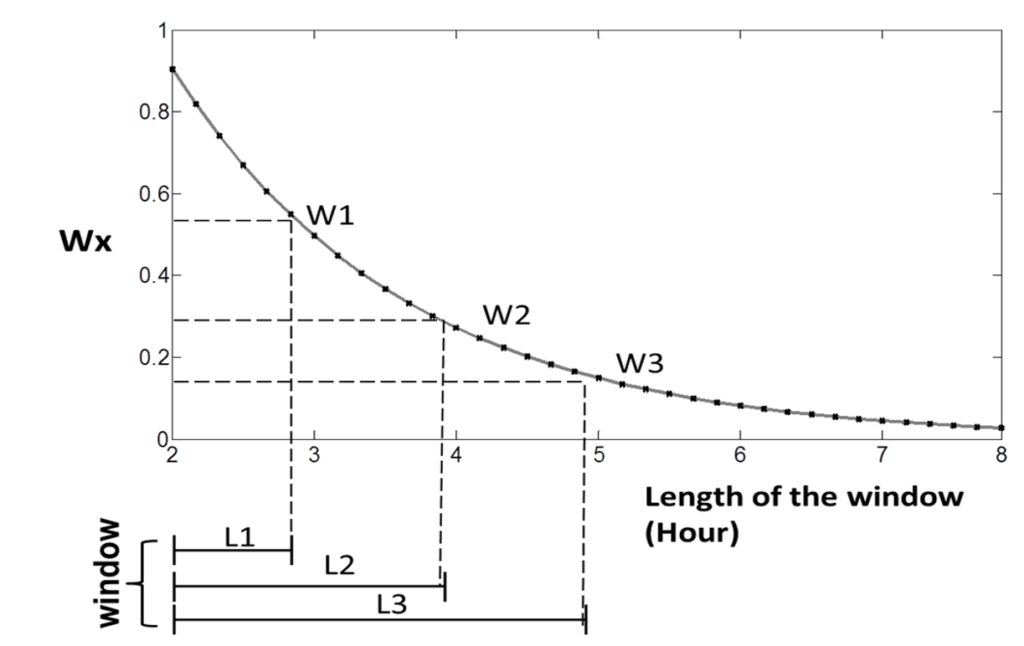
Figure 9 The negative exponential function showing on the y-axis the weight factor (Wx) and on the x-axis the window length (L). As shown longer windows have less weight in the final (multi-window) CPPopt calculation. Figure modified from Liu et al. Neurotrauma 2016.
6,7(Full) fit error (figure 10)
In the CPPopt algorithm a line is fitted through the data points by using the average bin values. Therefore the default error of fit is calculated using the average distance of the fitted curve from the fitted points, the 5 mmHg bin averages (Fit error). However the fit error (for Equation 1) could also be calculated using the original, pre-binnning, data points (Full fit error). As shown in Figure 10, when the average error increases, less weight is added to the weight factor.
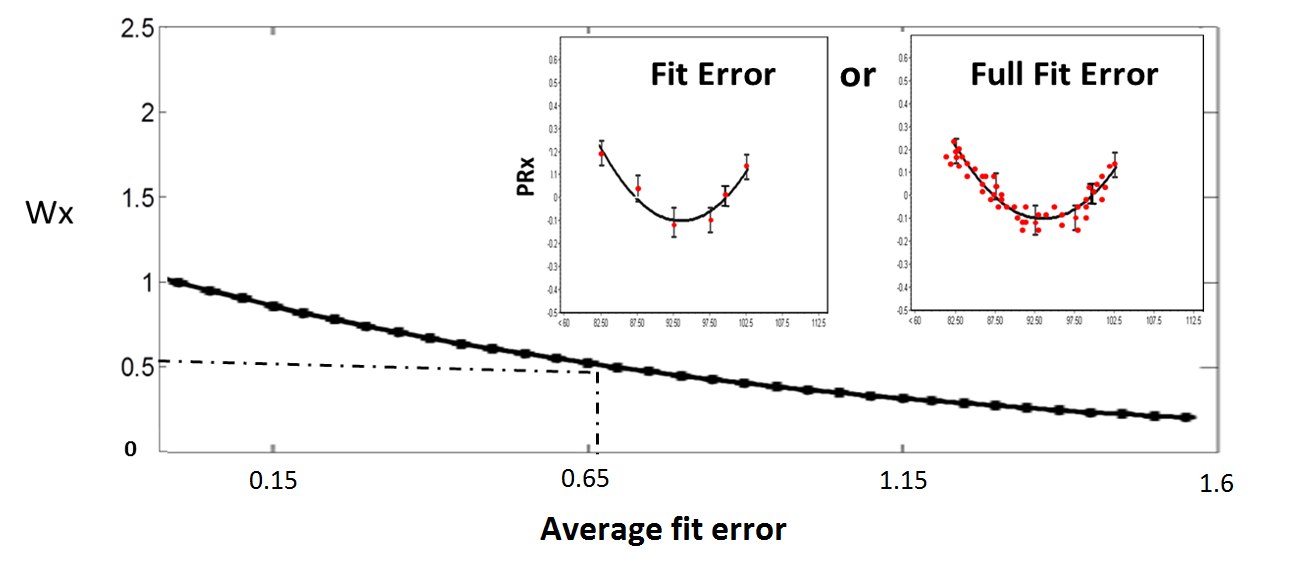
Figure 10 The option fit error (small left panel) shows the way a curve is fitted through the data points, using the average bin values. The option full fit error (small right panel) shows the method to quantify the fitted error using the original PRx value, before binning. This is done by calculating the error between the real data points and the fitted curve. In the main figure, the impact of the fit error is further explained. When the average fit error increases, less weight is added to the general weighting factor. Figure modified from Liu et al. Neurotrauma 2016.
8Non- parabolic window weight (figure 11)
The concept of CPPopt relies on the observations that U-shaped curves are present with a clear PRx minimum (parabolic curves, figure 11 (I)). Sometimes only parts of these curves are present in the selected calculation window. In this situation only ascending or descending curves/lines are present (non-parabolic curves, figure 11 (II)). CPPopt in these situations might be over- (ascending) or underestimated (descending).
To address this potential problem, parabolic curves (I) might be given more weight than the non-parabolic curves (II) in the final multi-window calculation. In contrast to window length and (full) fit-error, this rule is linearly related to the general weight factor. As seen in Equation 1, the parabolic weight has a fixed value 1 and the non-parabolic weight factor (γ) can be set in configuration. The lower the value of this weight factor, the less the overall weight factor is influenced by non-parabolic curves.
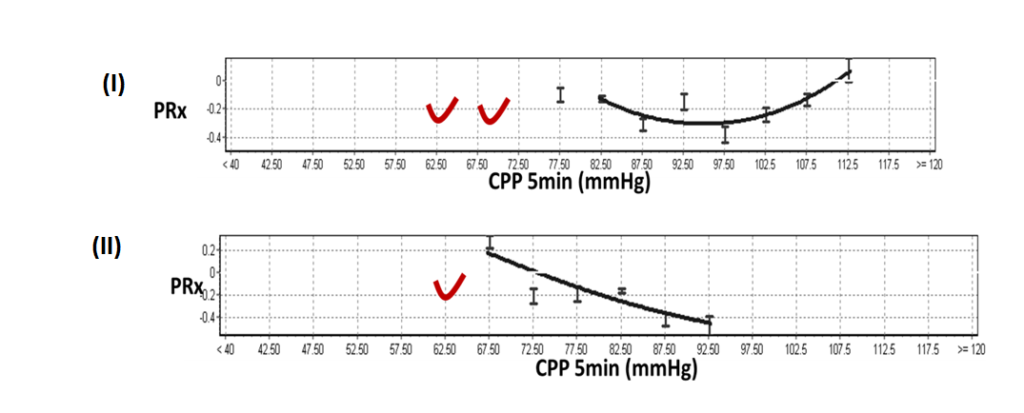
Figure 11 The CPP-PRx curve shown in (I) displays a parabolic (U shape) curve which is preferable above the non-parabolic CPP-PRx (descending) curve shown in the lower part (II). Figure modified from Liu et al. Neurotrauma 2016.
Table 2 CPPopt time trend line settings:
CPPopt Trends
| SETTING | DESCRIPTION | DEFAULT |
|---|---|---|
| Missing data limit | Percentage of missing data values in the calculation window below which the calculation will not be performed. | 50% |
| Number of bins | A CPP bin is the range of values that are stored as one unit. When the minimum bin is 40 mmHg and the maximum bin is 120 mmHg and the number of bins is set at 16, the CPP bin width is 5 mmHg. | 16 subsets (adults) |
| Minimum bin value | CPP bins below this minimum value are not used for curve fitting. | 40 mmHg (adults) |
| Maximum bin value | CPP bins above this maximum value are not used for curve fitting. | 120 mmHg (adults) |
| Minimum bin data count [%] | Relative minimum number of data points included in the bin for it to be available for the curve fitting. | 1-2% |
| Minimum included data [%] | Relative minimum number of data points that has to be covered by the fitted curve. | 50% |
| Minimum Y span A | Minimum span of PRx covered by the fitted curve. In other words, too flat curves (PRx span <0.2) are rejected. | 0.2 |
| Concave | If set a concave function (parabolic) will be used. | Not used for CPPopt |
| Need not to include ‘best’ | 'Best' CPP refers to the CPP bin with the lowest PRx value in the calculation period. If set, this option will only allow curve fitting when the curve covers the 'best' CPP bin. | Optional |
| Use error weighting | If set, this option will use error bar size to weight the contribution of the different CPP bins in the curve fitting process. | Optional |
| Enforce y-range | If set, this option makes sure the fitted curve overlaps the specified PRx values. If it is outside of the range the curve will be rejected. Settings to set: Enforce Y-range – Min, Enforce Y-region – Max. | Optional |
| Enforce Y-region – Min | This option sets the value for the LOWER border of the PRx range that the fitted curve must overlap. | -0.3 |
| Enforce Y-region – Max | This option sets value for the UPPER border of the PRx-range that the fitted curve must overlap. | 0.6 |
| Optimal range threshold | This option allows for calculation of LOWER and UPPER CPP limit of cerebrovascular reactivity (LLR/ULR). A PRx threshold has to be selected. | 0.25 |
| Output value type | Different output variables can be selected for the 'optimal range calculation'. | Optimal X is used. |
| Min. Calculation period | Minimum calculation period [s] for the multi- window approach. The 'maximum' calculation period is set in primary analysis window. This function is only relevant when 'multi-window treatment option' is Weighted Average (see below). | 7200 sec (2 hours). |
| Step | Step [s] by which the multi-window gets extended (retrospectively) with each iteration. Please read the text for an example. This function is only relevant when multi-window treatment option is Weighted Average. | 600 sec (10 min). |
| Multi window treatment | Different output values can be selected for this variable. | Weighted Average is used. |
| Window weight exp | Negative exponent of the 'calculation window duration' weight factor to be applied. Only applicable if multi window treatment is selected. | 0.5 |
| Fit error weight exponent | Negative exponent of the 'fit error' weight factor to be applied. Only applicable if multi window treatment is selected. | 1 |
| Use fullfit error | If set the fit error calculated on the original data point (full fit)- rather than bins means (standard fit error) - will be used. | Checked |
| Non-parabolic window weight | Weight applied to non-parabolic curve fitting results (ascending or descending lines). | 0.1 |
References
[1] Liu X, Czosnyka M, Aries MJH, et al. Monitoring of optimal cerebral perfusion pressure using a multi-window weighting algorithm in traumatic brain injured patients. Neurocritical Care 2017 [In Print].
[2] Depreitere B1, Güiza F, Van den Berghe G, Schuhmann MU, Maier G, Piper I, Meyfroidt G. Pressure autoregulation monitoring and cerebral perfusion pressure target recommendation in patients with severe traumatic brain injury based on minute-by-minute monitoring data. Journal of neurosurgery (2014).
[3] Sorrentino E, Diedler J, Kasprowicz M, Budohoski KP, Haubrich C, Smielewski P, Outtrim JG, Manktelow A, Hutchinson PJ, Pickard JD, Menon DK, Czosnyka M. Critical thresholds for cerebrovascular reactivity after traumatic brain injury. Neurocrit Care. 2012 Apr;16(2):258-66.
[4] Donnelly J, Czosnyka M , Adams H, Robba C, Steiner LA, Cardim D, Cabella B, Liu X, Ercole A, Hutchinson PJ, Menon DK, Aries MJH1, Smielewski P. Individualising CPP thresholds in severe Traumatic Brain Injury using cerebral pressure reactivity. Crit Care Med 2017 [In Print]