Pressure reactivity index (PRx)
PRx is the moving Pearson correlation between the slow waves in intracranial pressure (ICP) and arterial blood pressure (ABP). In 1997 the pressure reactivity index (PRx) was firstly described as acting dynamically to a decrease in CPP. This indicated that PRx could be used as an index for the cerebrovascular reactivity [1]. Cerebrovascular pressure reactivity (PRx) is distinct from autoregulation, but it cannot be denied that it is strongly related to it [2]. It has been shown in animal models that PRx accurately delineates the lower limits of autoregulation [3]. Numerous (retrospective) observations in different patient populations led to important correlations between averaged PRx and outcome [2].
Cerebrovascular reactivity and PRx
PRx is an index that can be used for describing the cerebrovascular reactivity by a simple input-output model. An explanation about PRx is given in the animation and the corresponding text below. One has to remember that PRx is probably only valid during periods with a strong relationship between (intracranial) pressure and intracerebral volume. This is visually represented by the (suggested) exponential part of the pressure-volume curve (figure 1, part II) by Marmarou et al.[4] This perquisite might limit the application of PRx in certain diseases or stages (like after decompression craniectomy).
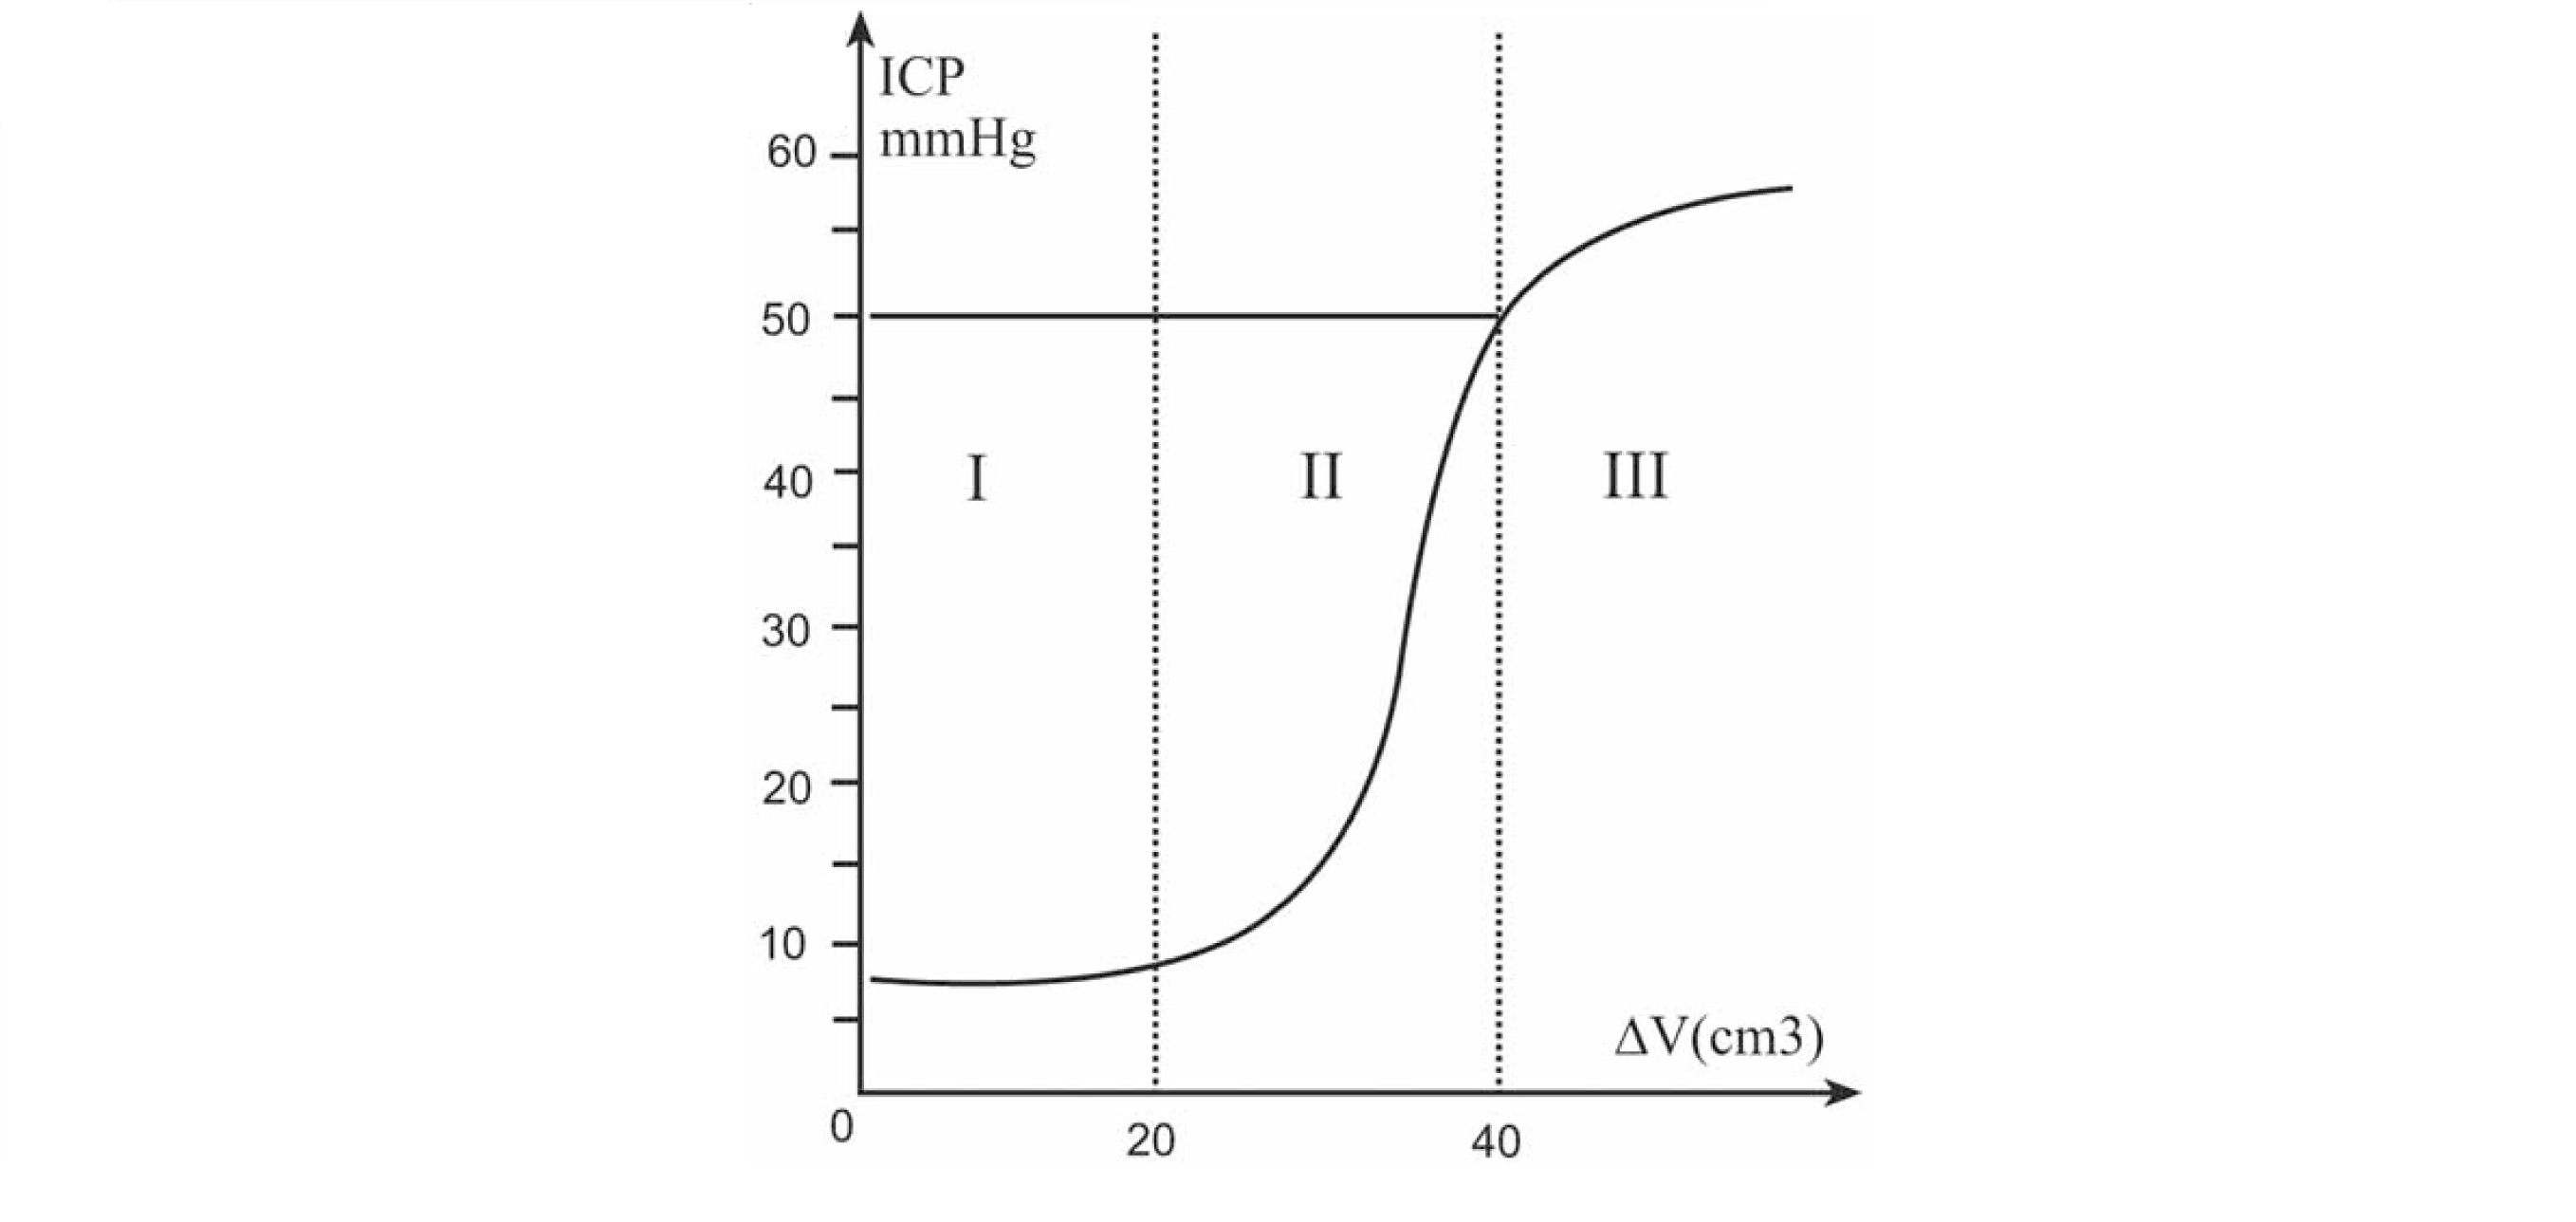
Figure 1 Patients on the exponential part of the curve (part II) have a poor compensatory reserve meaning that a slow change in the volume (ΔV) of the intracerebral space (i.e. because of changes in cerebral blood volume) causes significant changes in the intracranial pressure (ICP). Patients on the flat part of the curve have a good compensatory reserve (part I). During part III with very high cerebral volumes and consequently high ICP levels, the cerebral vessels collapse and the pressure-volume relationship is unpredictable.
The animation shows responsive and non-responsive cerebral vessels. The blue dots illustrates the statistical correlation (Pearson) coefficients between averaged values of ABP (input) and ICP (output). When the cerebral arterioles are non-responsive, slow changes in ABP are followed by a similar change in ICP (pressure passive system). This is in the animation seen as vasodilation of the brain vessels after an increase in ABP. In more details, when the ABP/cerebral perfusion pressure (CPP) increases the arterioles dilate and hence the cerebral blood flow, cerebral blood volume and consequently the ICP increases. The final PRx values get a positive value. Responsive cerebral arterioles counteract a slow change in ABP/CPP actively (pressure active system). When the ABP increases the cerebral blood flow stays relatively constant (in a certain range) as the blood vessels contract whereupon the cerebral blood volume stays constant or even decreases. The final PRx values show values around zero or even negative values.
Calculation in the software
The PRx is calculated in the ICM+ software as the (moving) Pearson correlation coefficient between 30 consecutive data points over a 5 minute period. Each ABP and ICP data points is averaged over 10 seconds to diminish the effect of breathing/ventilation. One PRx value is calculated every 5 minute but due to the moving average function (usually 80% overlap is chosen) an update is provided every minute. For an explanation of how to insert the PRx in the software click here. Charts used to represent the PRx can be a trend line or a color risk chart (figure 2). For the color-bar an upper and lower threshold should be set. Research to determine the exact threshold in certain diseases or patient groups is still ongoing. Retrospective studies have shown that averaged PRx values >0.24, >0.20 and >0.25 during the monitoring period are related to an increased mortality. [5][6][7]
A different approach to the PRx index is coupling the PRx values to corresponding CPP values. This is explained in the ‘CPP-PRx error bar’ section.
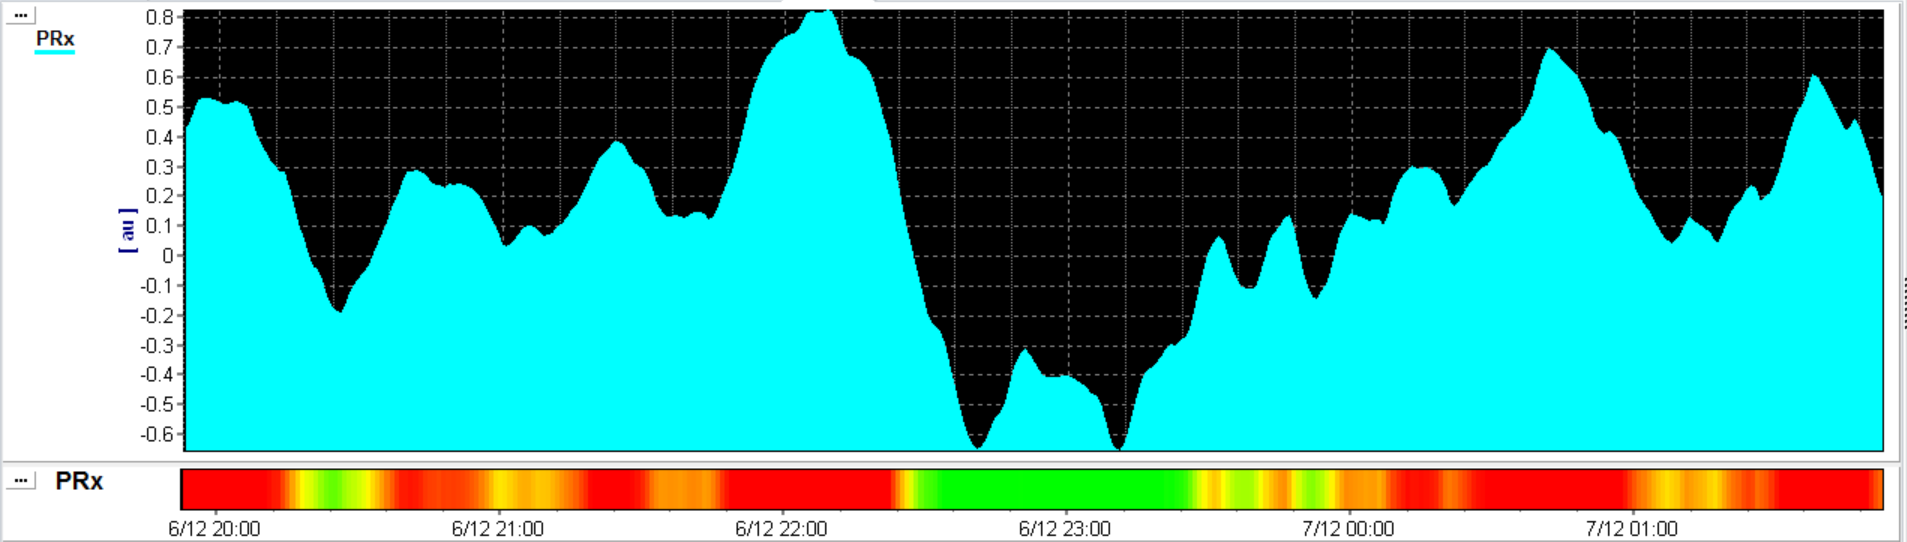
Figure 2 PRx trend line (smoothed) and the PRx risk chart with a threshold of 0.25. In the risk chart the ‘red’ colour represents periods with impaired cerebrovascular reactivity. During ‘green’ periods the cerebrovascular reactivity is probably intact. The time frame of this figure is 6 hours.
Pressure reactivity index: journey through the past 20 years.
Czosnyka, M., Czosnyka, Z., & Smielewski, P. (2017). Pressure reactivity index: journey through the past 20 years. Acta Neurochirurgica. http://doi.org/10.1007/s00701-017-3310-1
References
[1] Czosnyka M, Smielewski P, Kirkpatrick P, et al. Continuous Assessment of the Cerebral Vasomotor Reactivity in Head Injury. July 1997. Neurosurgery, 4: 11-19.
[2] Czosnyka M, Brady K, Reinhard M, et al. Monitoring of cerebrovascular autoregulation: facts, myths, and missing links. Neurocrit Care 2009; 10:373-386.
[3] Brady KM, Lee JK, Kibler KK, et al. Continuous measurement of autoregulation by spontaneous fluctuations in cerebral perfusion pressure: comparison of 3 methods. Stroke 2008; 39:2531-2537.
[4] Marmarou A, Shulman K, Rosende R. (1978). A nonlinear analysis of the cerebrospinal fluid system and intracranial pressure dynamics. Journal of Neurosurgery; 48:332–344.
{5] V.Petkus, S.Krakauskait, A.Preiksaitis, et al. Association between the outcome of traumatic brain injury patients and cerebrovascular autoregulation, cerebral perfusion pressure, age, and injury grades. Medicina (Lithuania), 52(1):46–53, 2016.
[6] A.Lavinio, B.Ene-Iordache, I.Nodari, et al. Cerebrovascular reactivity and autonomic drive following traumatic brain injury. Acta neurochirurgica. Supplement, 102:3–7, 2008.
[7] E.Sorrentino, J.Diedler, M.Kasprowicz, et al. Critical thresholds for cerebrovascular reactivity after traumatic brain injury. Neurocritical Care, 16(2):258–266, 2012.