
Wavelets applied to CPPopt methodology
CPPopt Yield
A perquisite for the introduction of autoregulation guided therapy at the bedside is the availability of sufficient CPPopt information during the monitoring period. The yield, which is the percentage of time (%) that a CPPopt value can be displayed, has recently been increased by the introduction of the multi-window weighted averaging approach (see ‘CPPopt Trends’). In the current section an overview is given regarding recent research using wavelet transformation applied to the Pressure Reactivity index, the so called ‘wavelet PRx’ (wPRx). [1] This method might contribute to a further increase in the CPPopt yield numbers. This research work was part of the PhD thesis of Xiuyun Liu (Cambridge, July 2017).
PRx versus wPRx
The pressure reactivity index (PRx) is known as the moving Pearson correlation coefficient between averaged arterial blood pressure (ABP) and intracranial pressure (ICP) values (see ‘PRx’). Over the years questions raised about the limitations of this time-domain index and the possibilities to reduce the influence of noise. Options would be to obtain pressure reactivity information in both the time- and frequency domain. Furthermore the effect of analysing the relationship between ABP and ICP as non-stationary signals.
Wavelet transformations apply complex calculations to analyse signals in both the frequency and time domain. This method also copes with noisy and non-stationary signals.[..] For that reason Liu et al. applied the wavelet transformation method to the ABP/ ICP signals and calculated the wavelet PRx (wPRx).
Marcel: Stukje hierboven heb ik iets herschreven. Lijkt me een mooie introductie zo.
Het stukje hieronder vind ik minder interessant omdat we het simple kunnen opschrijven als dat er een relatie is tussen afwijkingen van wCPPopt en CPP en outcome en dat wCPPopt een iets hogere yield geeft.
Wat ik denk ik interessanter zou vinden is dat we een korte uitleg geven over:
- Wat zijn wavelets? Hoe kun je nu zowel time domain als frequency domain hebben?
- Welke frequentie range? Welk getal krijg je hieruit? (phase in graden?)
- Hoe kan ik wavelet PRx berekenen? Ook weer moving average? Hoe ziet dat eruit (ivm PRx)?
- Hoe kan ik wavelet CPPopt berekenen? Zelfde instellingen? Hoe ziet dat eruit (ivm CPPopt)?
- Gaarne met figuren….. (basisinstellingen)
- Als laatste dan de de relatie met outcome (met de figuur) en yield.
- referenties….
Sorry als het weer veel werk is…. Het doel zou met name wezen om de method te kunnen gaan toepassen in de software.
We kunnen ook JW laten proeflezen. Die was ook ooit fan van wavelets.
gr,
marcel
……………………………………………
In the retrospective study 515 traumatic brain injury (TBI) patients were included. The patients were categorised followed the Glasgow Outcome Scale (GOS); favourable (good recovery and moderate disability)-unfavourable (severe disability, vegetative state, and death) and fatal (dead) – non fatal (good outcome, moderate disability, severe disability, and vegetative state). After comparing PRx with wPRx, the wPRx was used in the CPPopt calculation and the yield was determined. For the wavelet approach first the ABP and ICP signals were ‘filtered’ so that only signals with a true relationship between ABP and ICP were taken into account. This was performed by a Monte Carlo simulation (for details read Liu et al.) Second, the phase shifts – between ABP and ICP – were investigated. Third, the cosine of the phase shifts was calculated to come to the wPRx.
The PRx-wPRx analysis related to the patient’s GOS have shown that both PRx and wPRx can distinguish between a favorable (mean PRx (±SD) 0.03 ± 0.13, mean wPRx (±SD) 0.31 ± 0.17) and an unfavorable outcome (PRx 0.10 ± 0.17 (p < 0.001), wPRx 0.42 ± 0.18 (p < 0.001). In addition it can distinguish between a nonfatal (mean PRx (±SD) 0.05 ± 0.14, wPRx 0.34 ± 0.17) and a fatal outcome (PRx 0.15 ± 0.19 (p < 0.001), wPRx 0.48 ± 0.19 (p < 0.001).
CPPopt analysis
The use of wPRx in the CPPopt calculation showed a 12 % yield increase; mean (±SD) yield CPPoptPRx 53.2% ± 20% and CPPoptwPRx 59.6% ± 27%, p < 0.001). The patient’s outcome was studied as the difference between CPPopt and median CPP values (figure 1). For both PRx and wPRx an unfavorable outcome was related to large CPPopt-CPP differences (10-15 mmHg) whereas a favorable outcome was seen when the CPPopt value was close to the CPP value (0-5 mmHg).
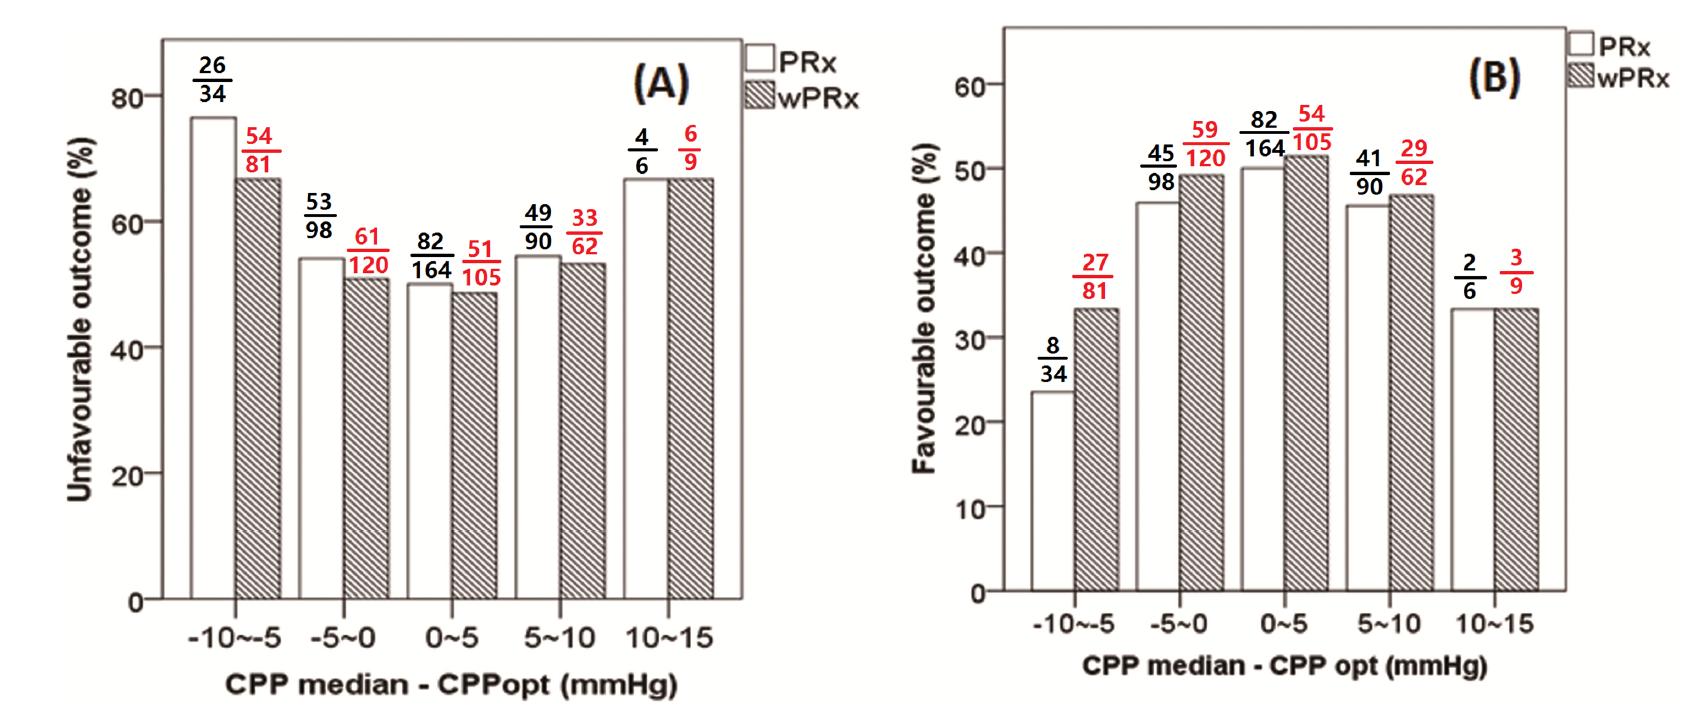
Figure 1, The Glascow Outcome Scale (GOS) for the categories unfavorable (A) and favorable (B) outcome. The bars were calculated as percentage from the overall CPP difference group. wPRx is given as dashed bars. The unfavorable group show a parabolic curve with a minimum for the CPPopt values close to the median CPP values. The favorable outcome group show a parabolic curve with a maximum for the CPPopt values close to the median CPP values. Both PRx and wPRx show a similar result.
Key message
As the results show the wPRx is a promising parameter to increase the CPPopt yield…. Liu et al. recommends to explore this new index in a prospective study.
Reference:
[1] Liu X, Donnelly J, Czosnyka M, et al. (2017). Cerebrovascular pressure reactivity monitoring using wavelet analysis in traumatic brain injury patients : A retrospective study, 1–19. http://doi.org/10.1371/journal.pmed.1002348.
————————————————————————————————————————–
The wavelet transform method, which has been widely applied in the field of geophysics and economics, has been found to be particularly useful for analyzing intermittent, noisy, and non-stationary signals [1], making it an ideal candidate for assessing cerebral pressure reactivity. The two parameters are typically used to characterize wavelet analysis are the wavelet phase shift, which measures the delay between the two signals over a range of frequencies and time points [2]; and the wavelet coherence, which characterize cross-correlations between two signals [3].
We applied wavelet transform analysis to assess cerebral pressure reactivity, termed wavelet pressure reactivity index (wPRx). Wavelet transform phase shift (WTP), the phase difference between ABP and ICP, in the frequency of 0.0067 Hz to 0.05 Hz was calculated through complex wavelet transform, described in Appendix [4,5–7]. Morlet mother wave with the central frequency at 1 Hz was applied stretched or compressed to match various components of ABP/ICP signals (See Appendix). A 500-second window was used to calculate WTP, in order to allow enough data points being calculated after removing the edge effect (see Appendix) [4,8], and updated every 10 seconds. Wavelet transform coherence (WTC) was applied as an indicator of a reliable phase relationship between input and output, decided through Monte Carlo simulations approach. The simulations were conducted 10000 times to generate the distribution of estimated wavelet transform coherence (WTC) values of two uncorrelated signals[4,9]. If the actual value of WTC was higher than 95 % of the WTC values obtained in this artificial unrelated surrogate distribution, it was assumed to be high enough to indicate a significant relationship between input and output. Individual WTP values with WTC higher than the threshold were included, while the points with WTC lower than the threshold were ignored. The cosine of the WTP angle was calculated afterwards, termed wavelet pressure reactivity index (PRx), for two reasons: First, the phase angle is converted to a number between -1 (180 degrees phase shift) and +1 (0 degrees phase shift) that is directly comparable to the PRx. Second, the cosine operation offers a practical solution to the problem of phase wrapping as it is effectively equivalent to the normalized real part of the complex wavelet cross-spectrum value.
The result showed that there was a significantly positive relationship between PRx and wPRx (r = 0.73) and wPRx performed better in distinguishing between mortality and survival (AUROC for wPRx was 0.73 vs 0.66 for PRx, p = 0.003).
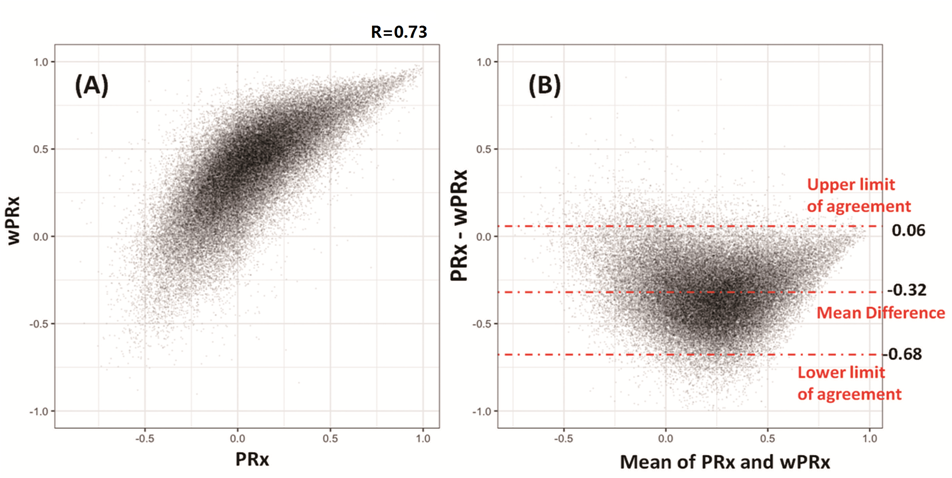
Fig.1 Relationship between PRx and wPRx. (A) There was a strong positive, non-linear relationship between PRx and wPRx. (B) Bland Altman plot showing disagreement of the two parameters, with a tendency for a positive wPRx-PRx difference. PRx: pressure reactivity index; wPRx: wavelet pressure reactivity index.
- CPPopt_wPRx
The optimal cerebral perfusion pressure (CPPopt) can also be obtained through wPRx. As described by Aries et al [10] , the automatic curve fitting methodology was used to estimate CPPopt value based on wPRx (CPPopt_wPRx). In summary, the wPRx values were divided into CPP bins spanning 5 mmHg [10]; the mean value and standard deviation of wPRx in each bin were plotted against the bins’ mean CPP to create an error bar chart showing the relationship between wPRx and CPP; theoretically, this relationship should form a U-shape curve with the CPP value at the lowest wPRx representing the best cerebral autoregulation, termed CPPopt. The CPPopt was calculated using a 4-hour calculation window with an update every minute by fitting a second order polynomial to the bin averages of Fisher transformed wPRx values and returning the minimal value from within the part of the curve within the available CPP range (please see Aries at all for more details) [10]. The first CPPopt curve could be generated when at least 50% of the required data points of (w)PRx were available, i.e. after a minimum of 2 hours of monitoring.
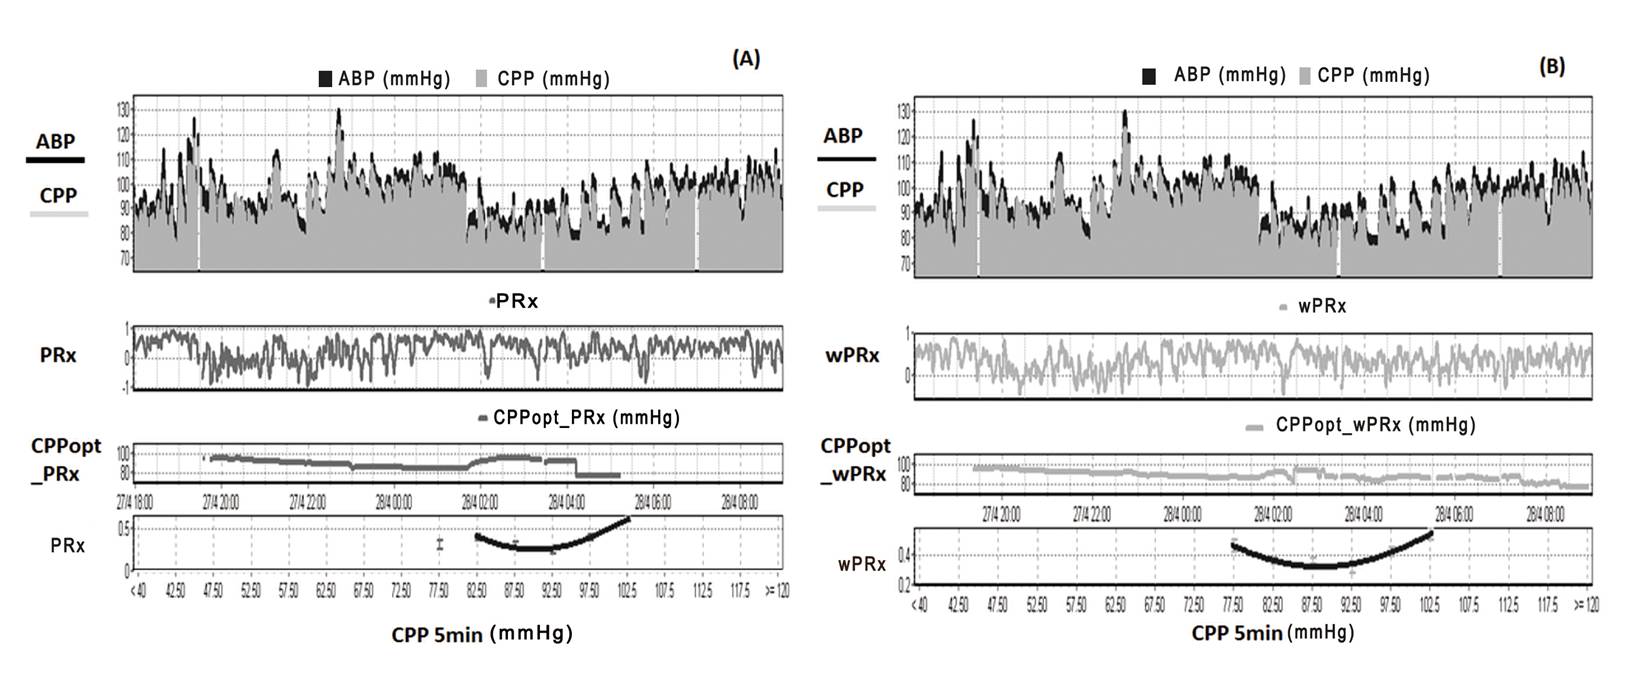
Figure 2. Example of data analysis using ICM+, showing time trends of ABP, CPP, CA and CPPopt. (A) Time trends of ABP, CPP, pressure reactivity index (PRx) and CPPopt according to PRx. (B) Time trends of ABP, CPP, wavelet pressure reactivity index (wPRx) and CPPopt according to wPRx. The U-shape curves at the bottom panels were used to determine automated CPPopt with curve fitting method. The (w)PRx-CPP plot was created using CPP 5 minute mean value as x-axis, with averaged (w)PRx values in CPP bins spanning 5 mmHg as y-axis. ABP: arterial blood pressure, CPP: cerebral perfusion pressure, CA: cerebral autoregulation, CPPopt: optimal CPP.
We compared the relationship between CPPopt according to PRx (CPPopt_PRx) and CPPopt_wPRx using the average value of CPPopt across the whole monitoring period for each patient. In addition, the difference between median CPP and CPPopt were calculated continuously (ΔCPP = median CPP – CPPopt) and averaged for the whole monitoring period. The yield index was used to test the continuity of CPPopt and was calculated as the ratio between the count of valid CPPopt values and the count of CPP values across the whole monitoring period of each patient.
The mean difference between the patients’ CPP and their CPPopt was related to outcome for both calculation methods. There was a good relationship between the two CPPopts (r=0.814, p<0.001).
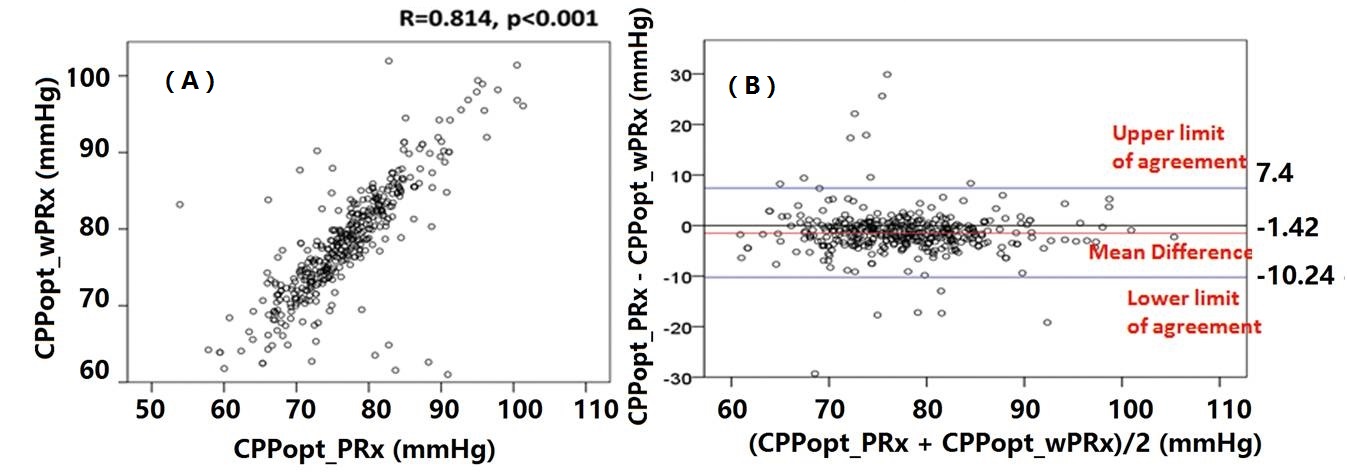
Figure 3. Relationship between CPPopt_wPRx and CPPopt_PRx(A) and Bland Altman plot of CPPopt_wPRx and CPPopt_PRx, showing high agreement of the two parameters (B).
Fig 4 demonstrated the relationship between favorable outcome, unfavorable outcome, mortality rate, severe disability rate and ΔCPP. The mortality increased steadily with the median CPP shifting below the threshold of CPPopt both according to wPRx and PRx (Fig 4C). An inverse ‘U’ shape curve with the highest favorable outcome rate appeared at the smallest difference between CPP and CPPopt is seen in Fig 5B. To the contrary, the unfavorable outcome showed a rate increasing below or above CPPopt (Fig 4A). Severe disability rate was increased while median CPP is above CPPopt (Fig 4D). Figure 6 shows the distribution of GOS Score (%) versus binned difference between the median CPP and CPPopt_PRx or median CPP and CPPopt_wPRx bins for the whole monitoring period.
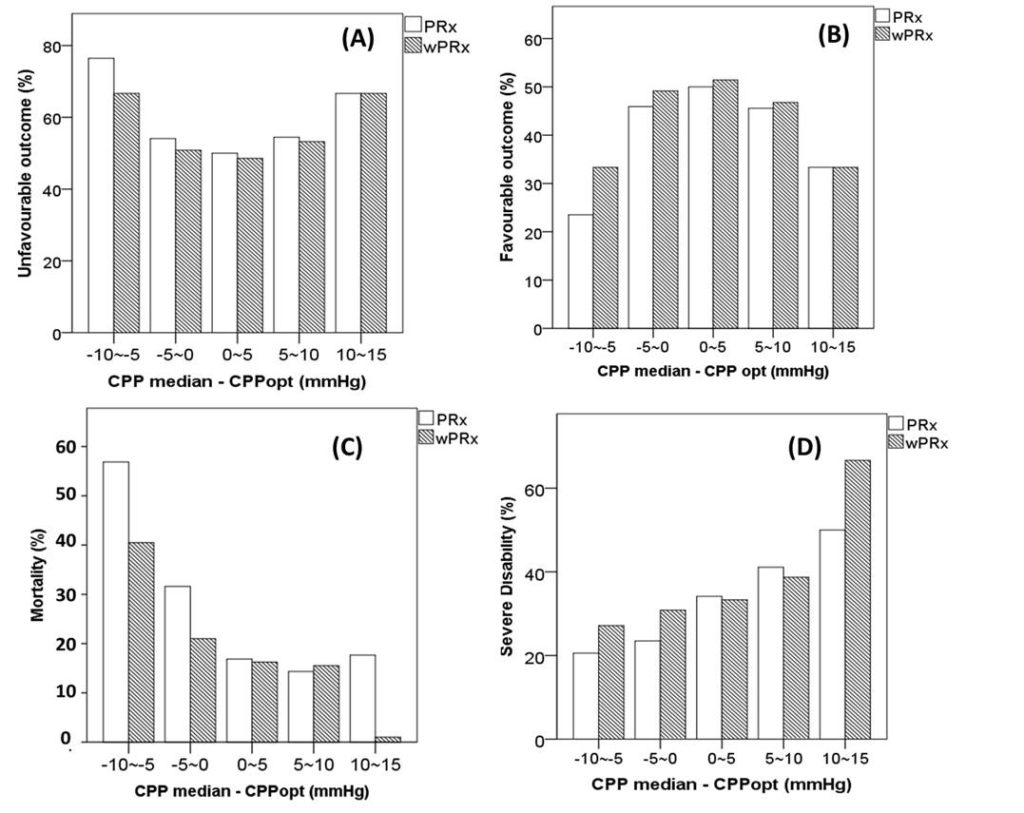
Fig 4. Graphs of the relationship between patient outcome and ΔCPP according to PRx (white bar) and wPRx (striped bar).
References
- Addison P. The Illustrated Wavelet Transform Handbook [Internet]. Biomedical Instrumentation & Technology. 2002. doi:10.1201/9781420033397
- PS A. Identifying stable phase coupling associated with cerebral autoregulation using the synchrosqueezed cross-wavelet transform and low oscillation morlet wavelets. Conf Proc IEEE Eng Med Biol Soc. 2015;8: 5960–3.
- Grinsted a., Moore JC, Jevrejeva S. Application of the cross wavelet transform and wavelet coherence to geophysical time series. Nonlinear Process Geophys. 2004;11: 561–566. doi:10.5194/npg-11-561-2004
- Grinsted a., Moore JC, Jevrejeva S. Application of the cross wavelet transform and wavelet coherence to geophysical time series. Nonlinear Process Geophys. 2004;11: 561–566. doi:10.5194/npg-11-561-2004
- Keissar K, Davrath LR, Akselrod S. Coherence analysis between respiration and heart rate variability using continuous wavelet transform. Philos Trans A Math Phys Eng Sci. 2009;367: 1393–1406. doi:10.1098/rsta.2008.0273
- Keissar K, Davrath LR, Akselrod S. Coherence analysis between respiration and heart rate variability using continuous wavelet transform. Philos Trans A Math Phys Eng Sci. 2009;367: 1393–406. doi:10.1098/rsta.2008.0273
- Addison PS. The discrete wavelet transform. The Illustrated Wavelet Transform Handbook: Applications in Science, Engineering, Medicine and Finance. 2002. p. 353. doi:10.1887/0750306920
- Torrence C, Compo GP. A Practical Guide to Wavelet Analysis. Bull Am Meteorol Soc. 1998;79: 61–78. doi:10.1175/1520-0477(1998)079<0061:APGTWA>2.0.CO;2
- Keissar K, Davrath LR, Akselrod S. Coherence analysis between respiration and heart rate variability using continuous wavelet transform. Philos Trans A Math Phys Eng Sci. 2009;367: 1393–1406. doi:10.1098/rsta.2008.0273
- Aries MJH, Czosnyka M, Budohoski KP, Steiner L a., Lavinio A, Kolias AG, et al. Continuous determination of optimal cerebral perfusion pressure in traumatic brain injury. Crit Care Med. 2012;40: 2456–2463.